
Climbing the Wall of Worry
THE MARKETS
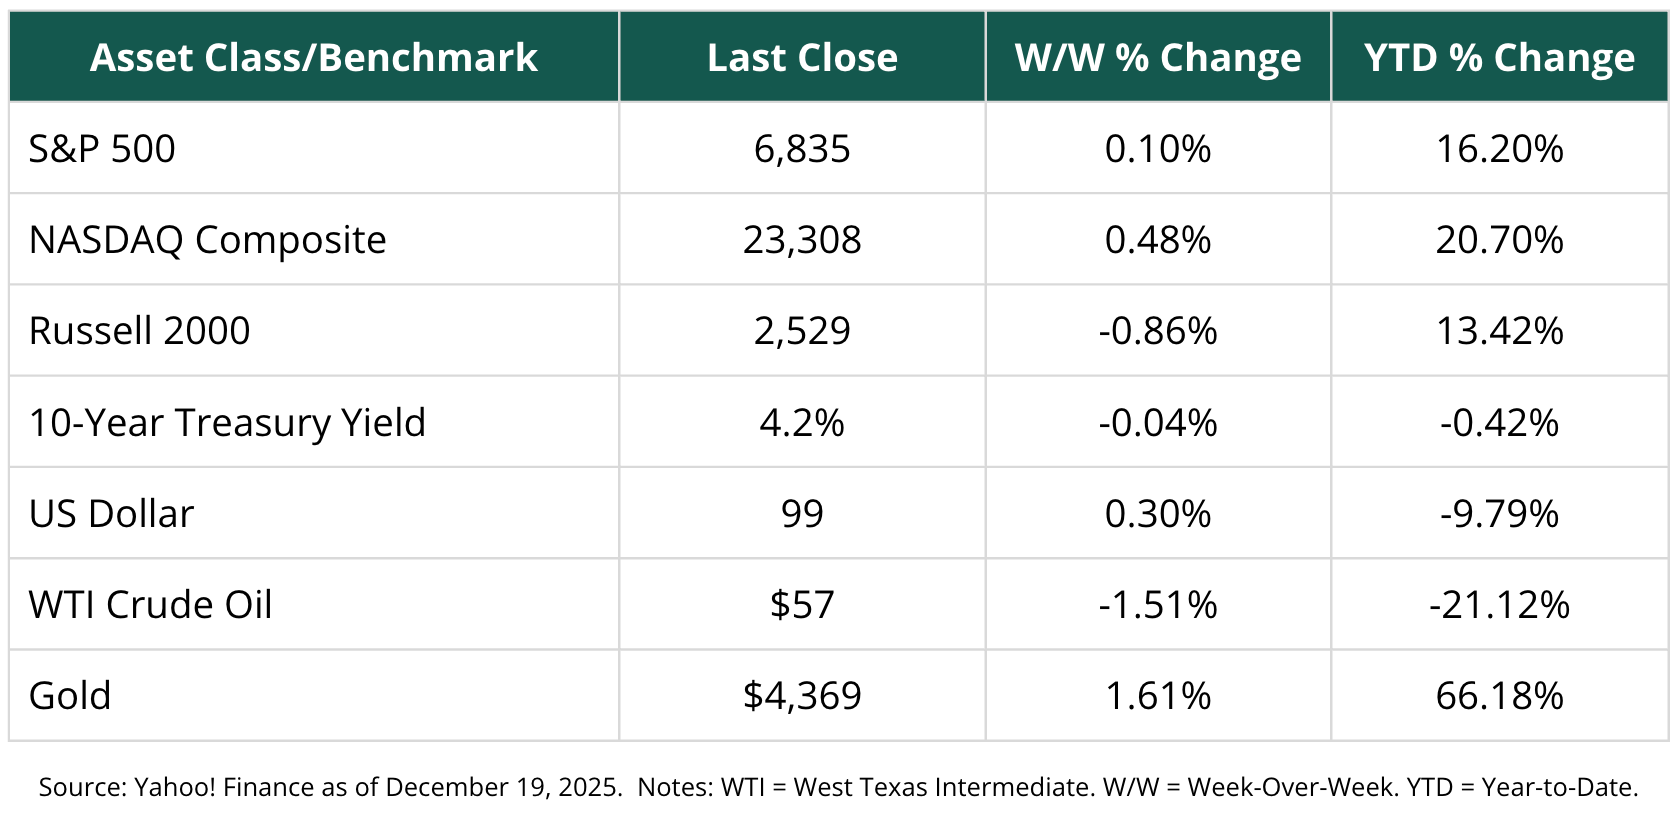
Markets sent mixed signals last week, with modest gains in large-cap stocks offset by weakness in smaller companies and commodities. The S&P 500 edged slightly higher, while the NASDAQ Composite posted a firmer gain, reflecting continued leadership from growth and technology-oriented stocks. By contrast, the Russell 2000 slipped, suggesting investors remain selective and less willing to take on smaller-cap risk for now.
In fixed income, Treasury yields eased modestly, with the 10-year yield ticking lower. That move points to slightly easier financial conditions and some renewed demand for safety, even as equity markets hover near highs. The U.S. dollar strengthened on the week, though it remains sharply lower year to date, continuing a trend that has generally been supportive of risk assets and international exposure.
Commodities were weaker overall. WTI crude oil declined again, reinforcing the theme of softer energy prices and easing inflation pressure. Gold, however, moved higher, extending its strong year-to-date performance as investors continue to value diversification and hedges amid elevated valuations and geopolitical uncertainty.
In short, leadership remains narrow but constructive: Large-cap growth stocks are still carrying the market, interest rates are cooperating, and inflation-sensitive assets are sending calmer signals—even if not all corners of the market are participating equally.
TRIUMPH OF THE OPTIMISTS
“Bull markets are born on pessimism, grow on skepticism, mature on optimism, and die on euphoria.” — Sir John Templeton
As we look ahead to 2026, we continue to see more forces working in favor of investors than against them. That doesn’t mean stocks move in straight lines—if they did, investing would be boring (and everyone would be rich). Instead, markets tend to climb a wall of worry. And right now, that wall is sturdy—but scalable.
THE WALL OF WORRY: SEVEN HEADWINDS TO WATCH
“The time of maximum pessimism is the best time to buy.” — John Maynard Keynes
Think of these as the loose bricks investors keep pointing at while the market quietly climbs higher:
1. Japanese rate hikes and a potential global carry-trade unwind
2. A growth and employment scare
3. Private credit defaults, fraud risk, or banking stress
4. Geopolitical flare-ups
5. Artificial intelligence (AI) investment fatigue or doubt
6. Reciprocal tariff refunds, and an inflation scare
7. Elevated starting valuations
These are real risks. They deserve monitoring—but not panic.
THE WIND AT OUR BACKS: TEN TAILWINDS FOR 2026
Now for the fun part. These are the forces we believe will push the bears—kicking and clawing—across the finish line next year:
1. Easing financial conditions and lower interest rates
2. Economic re-acceleration and strong revenue growth
3. A capex surge and tax relief from the One Big Beautiful Bill (OB3)
4. Healthy, high-end consumers with strong balance sheets
5. Swollen cash balances and ample dry powder
6. Tech mania 2.0 and an AI-driven productivity boom
7. Cooler inflation and slower unit labor cost growth
8. High margins and robust earnings growth
9. Simpler regulation and lower compliance costs
10. Extremely negative consumer sentiment (one of our favorite contrarian signals)
THREE ROADS FORWARD: 2026 SCENARIOS
8,500 — Base Case (68% probability)
In our bullish base case, we see the S&P 500 rising 20%+ to 8,500 in 2026. The math is refreshingly old-fashioned:
- Earnings growth: 15%+ (roughly $320)
- Valuation expansion: Modest to ~27x
Yes, the market trades at ~25–26x trailing earnings today. But history reminds us that valuations have pushed near 30x in prior cycles. If stocks feel expensive now… just wait.
To our knowledge, this is the highest 2026 price target on the Street. We think many strategists remain under-positioned and may spend much of the year chasing the rally. Persistent pessimism—and sidelined cash—remain powerful fuel.
9,200 — Upside Case (16% probability)
In this scenario, the AI trade reaches a fever pitch, tech-enabled companies go parabolic, and the market touches its +2 standard deviation band faster than expected.
7,800 — Downside Case (16% probability)
Here, some of the headwinds temporarily slow the bull. Even so, note this carefully: Our bear case is still many firms’ bull case.
A BULL MARKET WITH PLENTY OF RUNWAY
The current bull market began in October 2022, making it just over three years old. Historically speaking, that’s not old—It’s middle-aged and still energetic.
Using a log-linear regression of the S&P 500 against time, we find something both simple and powerful: Prices are largely a function of time. In plain English, 8,500 isn’t heroic—it’s plausible.
Yes, it sounds like a big number. But markets don’t care about round-number anxiety.
THOUGHTS ON THE MARKET OUTLOOK
“The stock market is a device for transferring money from the impatient to the patient.” — Warren Buffett
As we head into year-end, weekly data tell a cleaner story than daily noise. Viewed from a longer lens, the S&P 500 has broken above most key resistance levels and successfully tested support during this year’s pullbacks.
The market:
• Corrected
• Found support
• Recovered
• Built a base
That’s what healthy markets do.
Trend indicators remain positive but not euphoric. Momentum faded, then stabilized, and now appears to be improving. This is the market catching its breath—not collapsing.
Recall Icarus: Flying straight up without pauses rarely ends well. Markets that rest, test support, and then climb higher are far more durable.
This bull market has climbed a formidable wall of worry—and we believe it’s far from finished. As long as earnings grow, rates ease, and pessimism persists, the path of least resistance remains higher.
INTERESTING FACTS & FIGURES
Did you know that:
• The human brain uses about 20% of the body’s total energy, despite accounting for only ~2% of body weight. No wonder decision fatigue is real—especially during volatile markets.
• Honey never spoils. Archaeologists have found edible honey in ancient Egyptian tombs that’s over 3,000 years old. Patience, it turns out, has remarkable shelf life.
• The average person will spend roughly six months of their life waiting at red lights. Long-term investors know that waiting—when done intentionally—often pays off.
• Octopus arms have independent neural control. Each arm can solve problems on its own, making octopuses one of the most decentralized thinkers in nature—an underrated metaphor for diversification.
• A modern smartphone has more computing power than NASA used to land Apollo 11 on the moon. Technological progress—much like markets—rarely moves in straight lines, but it compounds faster than most expect
THIS WEEK IN HISTORY
December 22, 1968 — Apollo 8 became the first crewed spacecraft to orbit the Moon, broadcasting live images of Earth from lunar orbit.
During the mission, astronaut William Anders captured the iconic “Earthrise” photograph—showing our planet rising above the Moon’s horizon. It fundamentally changed how humanity viewed Earth: Fragile, finite, and shared.
“We came all this way to explore the Moon, and the most important thing is that we discovered the Earth.” — William Anders
Much like investing, sometimes the greatest insights come not from chasing the destination—but from stepping back and gaining perspective. When in doubt, zoom out.
Best Regards,
Andrew Zittell
Yerba Buena Financial Partners
Andrew Zittell, CLU®, ChFC®, AIF®, RFC® is a registered representative with, and securities offered through LPL Financial, Member FINRA/SIPC. Investment advice is offered through WCG Wealth Advisors, LLC, a registered investment advisor. The Wealth Consulting Group, WCG Wealth Advisors, LLC, and Yerba Buena Financial Partners are separate entities from LPL Financial.
The LPL Financial registered representative(s) associated with this website may discuss and/or transact business only with residents of the states in which they are properly registered or licensed. No offers may be made or accepted from any resident of any other state.
Sources: Federal Reserve Economic Data (FRED) – Historical S&P 500 data, trendline analysis, and macroeconomic indicators; Bloomberg – Market pricing, technical indicators (DMA, DMI, ADX, MACD), sector performance, and security-level data; WCG Investment Strategy Committee (ISC) – Internal analysis, portfolio positioning, scenario probabilities, and proprietary research; S. Bureau of Economic Analysis (BEA) – Revenue, profit, and macroeconomic growth trends; Federal Reserve Board – Monetary policy context, financial conditions, and labor market considerations; NASA – Apollo 8 mission history and “Earthrise” photograph background (December 22, 1968); Peer-reviewed neuroscience and biology research – Human brain energy consumption and octopus neural system facts; Archaeological research publications – Long-term preservation properties of honey; Technology history archives – Comparative computing power of modern smartphones versus Apollo-era systems.
Disclosures:
- Bond yields are subject to change. Certain call or special redemption features may exist which could impact yield. (118-LPL)
- The S&P 500 is a stock market index tracking the stock performance of 500 of the largest companies listed on stock exchanges in the United States. Indexes are unmanaged and cannot be invested in directly. (102-LPL)
- The NASDAQ Composite Index measures all NASDAQ domestic and non-U.S. based common stocks listed on The NASDAQ Stock Market. The market value, the last sale price multiplied by total shares outstanding, is calculated throughout the trading day, and is related to the total value of the Index. Indexes are unmanaged and cannot be invested in directly. (112-LPL)
- The fast price swings in commodities will result in significant volatility in an investor’s holdings. Commodities include increased risks, such as political, economic, and currency instability, and may not be suitable for all investors. (122-LPL)
- There is no guarantee that a diversified portfolio will enhance overall returns or outperform a non-diversified portfolio. Diversification does not protect against market risk. (26-LPL)